A traffic statistics overview for a certain period on individual physical servers and routes (lines) is available in MasterDC’s Customer Administration (https://admin.masterdc.com/en/). This guide explains what kind of data can be found in the statistics.
The traffic of the routes and physical servers can be viewed in two modes:
- Statistics – Data transferred in a year’s specific month, listed in GiB (1 GiB = 230 bytes).
- Graphs – Data transmissions of a chosen period, listed in Mbps (Megabits per second).
Physical Server Traffic Statistics
Physical server traffic statistics are read from the physical ports of switches connected and assigned to your servers in the system. The graphs include all the traffic passing through these ports. However, if one of your servers represents another router, this is the sum of the traffic on both devices.
In the Physical servers section on the left-hand side menu, click on the server you want to display more information about. The following submenu will show:

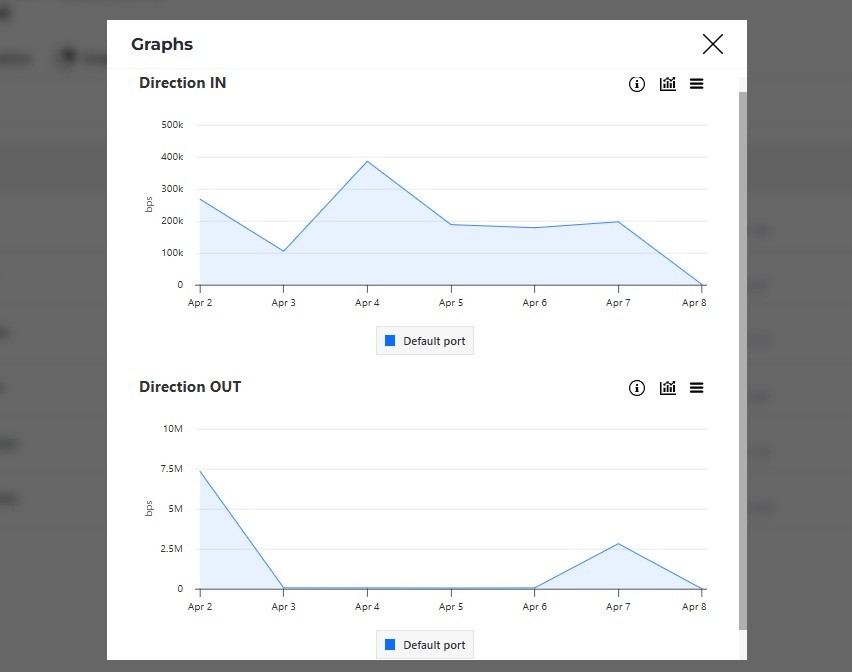
In the Graphs tab, you will find statistics of the data flowing through the server for the selected period. You can also view the statistics on a daily, weekly, monthly, or yearly basis. The daily display interval is after 5 minutes, weekly after 1 hour, monthly after 4 hours, and yearly always after days. Two curves, IN and OUT, are also shown, representing the outgoing traffic from the server.
In the Statistics tab, you will find a list of the past months. Next, choose the desired month and click on the Graph button.
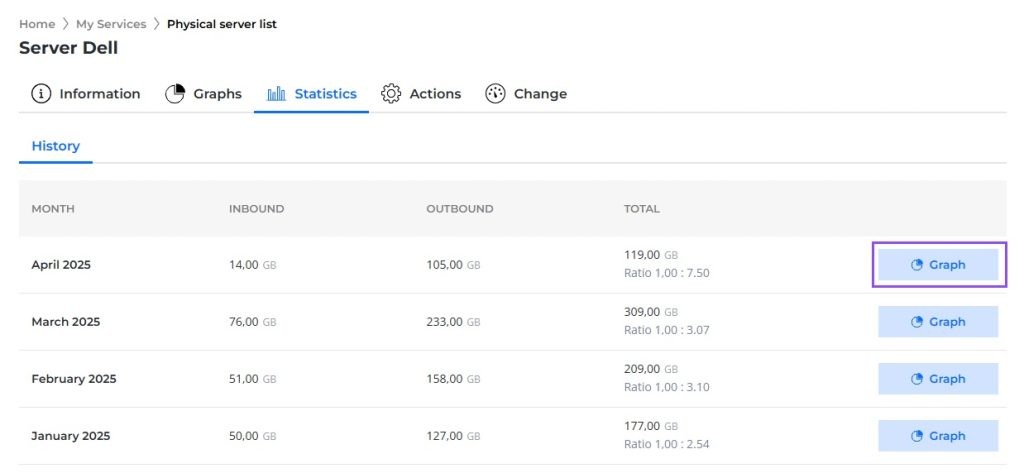
A graph of the monthly traffic contains two directions: IN and OUT. These directions are oriented to the port of MasterDC’s switch, meaning IN = outgoing traffic from your server.
Route Operations
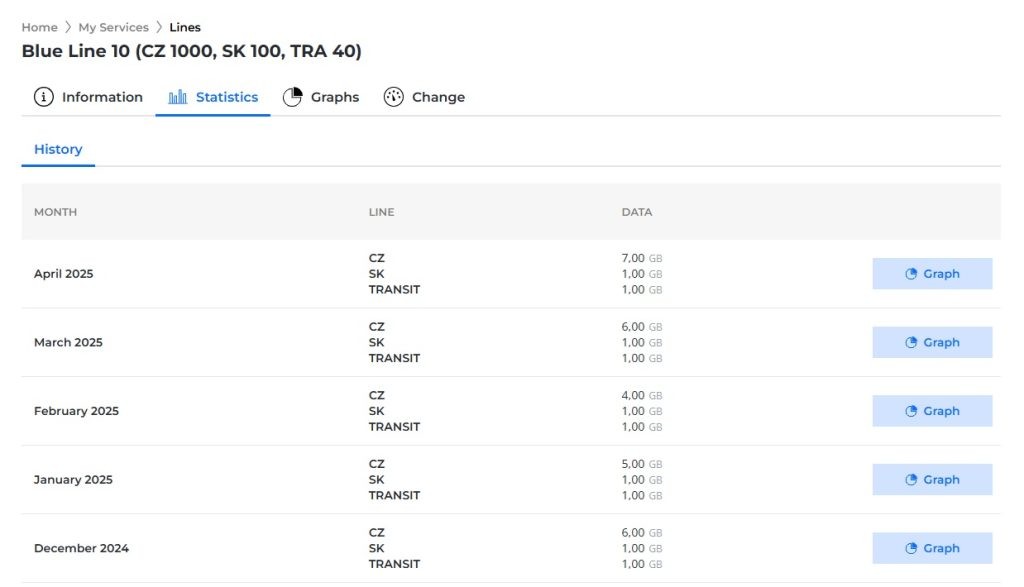
Information about the routes in operation is available in the Line services option on the left-hand side menu. In this section, select the specific line, e.g., Blue Line. Details about that line will then be displayed – information about the line, monthly overview, and the statistics of your IP addresses incoming and outgoing traffic (IN and OUT).
Tariff Method
Your route can be fixed (unmetered), metered, or billed at the 95th percentile. For fixed (unmetered) lines, you pay a fixed flat rate for a certain bandwidth. Therefore, it does not matter how heavily you use the line or, more precisely, how much data you transfer. The bandwidth of your route is listed in the Info tab under the Routing information heading (e.g., 100 Mbps, 1 Gbps, etc.). This limit cannot be exceeded; thus, you will never be charged additional fees.
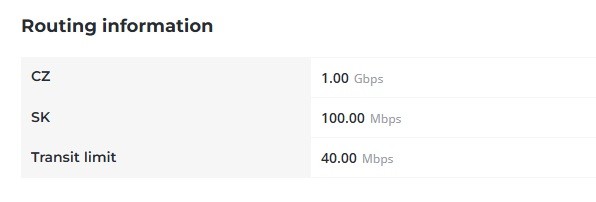
In the case of metered lines, you pay for the actual volume of transferred data. However, you always prepay a certain limit; for example, it can be 100 MB, 3 TB, etc. Therefore, the amount of data exceeding this limit will be charged retroactively. The limit of the metered line is also listed in the Info tab under the heading Line information (e.g., Transit Limit: 40 Mbps). If you are interested in the amount you will be charged if you exceed the set limit, it will be found under the Payment info heading.
Lines with the 95th percentile are recorded in regular five-minute intervals from the physical service port. The average bit rate of the five-minute intervals in bits per second is determined from the measured data. These values are ranked from highest to lowest at the end of each billing period, either for the service port or transmission directions (CZ, SK, and Transit). Then, the top 5% of values are removed from the list, and the remaining highest value represents the 95th percentile. This value is decisive for the service usage billing.
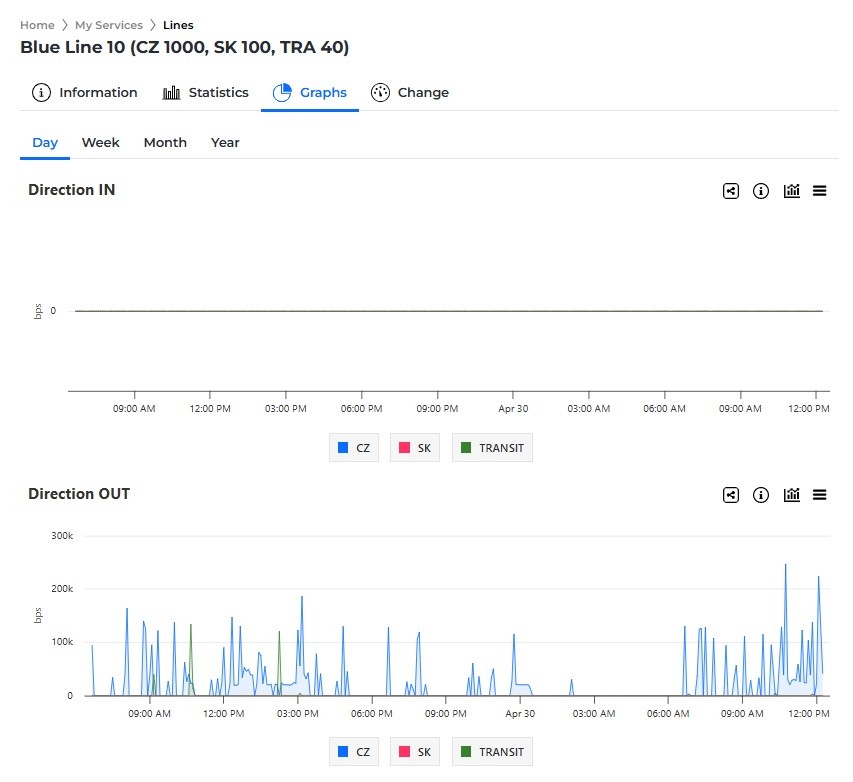
Graphical Display of Traffic
An overview of your line services traffic is under the following tabs: Statistics and Graphs. These graphs are generated from NetFlow traffic analyses at the MasterDC datacentre network edge. The direction is also oriented to your IP, meaning IN = incoming traffic to the IP.
In Statistics, you will find a graph showing the data transferred during the specific month. You can filter the curves representing certain directions (CZ for the Czech Republic, SK for Slovakia, and Transit for other countries). Two graphs are always displayed, one for incoming and one for outgoing traffic, and the interval is always one day.
In the Graphs tab, you can view the data flow. Statistics can be displayed on a daily, weekly, monthly, and yearly basis (same intervals as for physical servers). The number of curves is equal to the number of directions. The display of individual directions can be filtered by checking the desired items: CZ, SK, or Transit.
IP Address Statistics
You can find the statistics of individual IPs in the Network services section. Click on Per IP accounting to go to the IP Addresses Statistics where you can view graphs and statistics for specific addresses.
In the Graphs tab you can select a specific IP address, choose daily, weekly, monthly or yearly statistics and filter the view by line direction.